

This is an interface on which you can find summary information about your sales, as well as generate reports by different criteria. The screen is divided into several parts: Header (1), Filter (2), Graph (3) and Result (4) and Distribution (5):
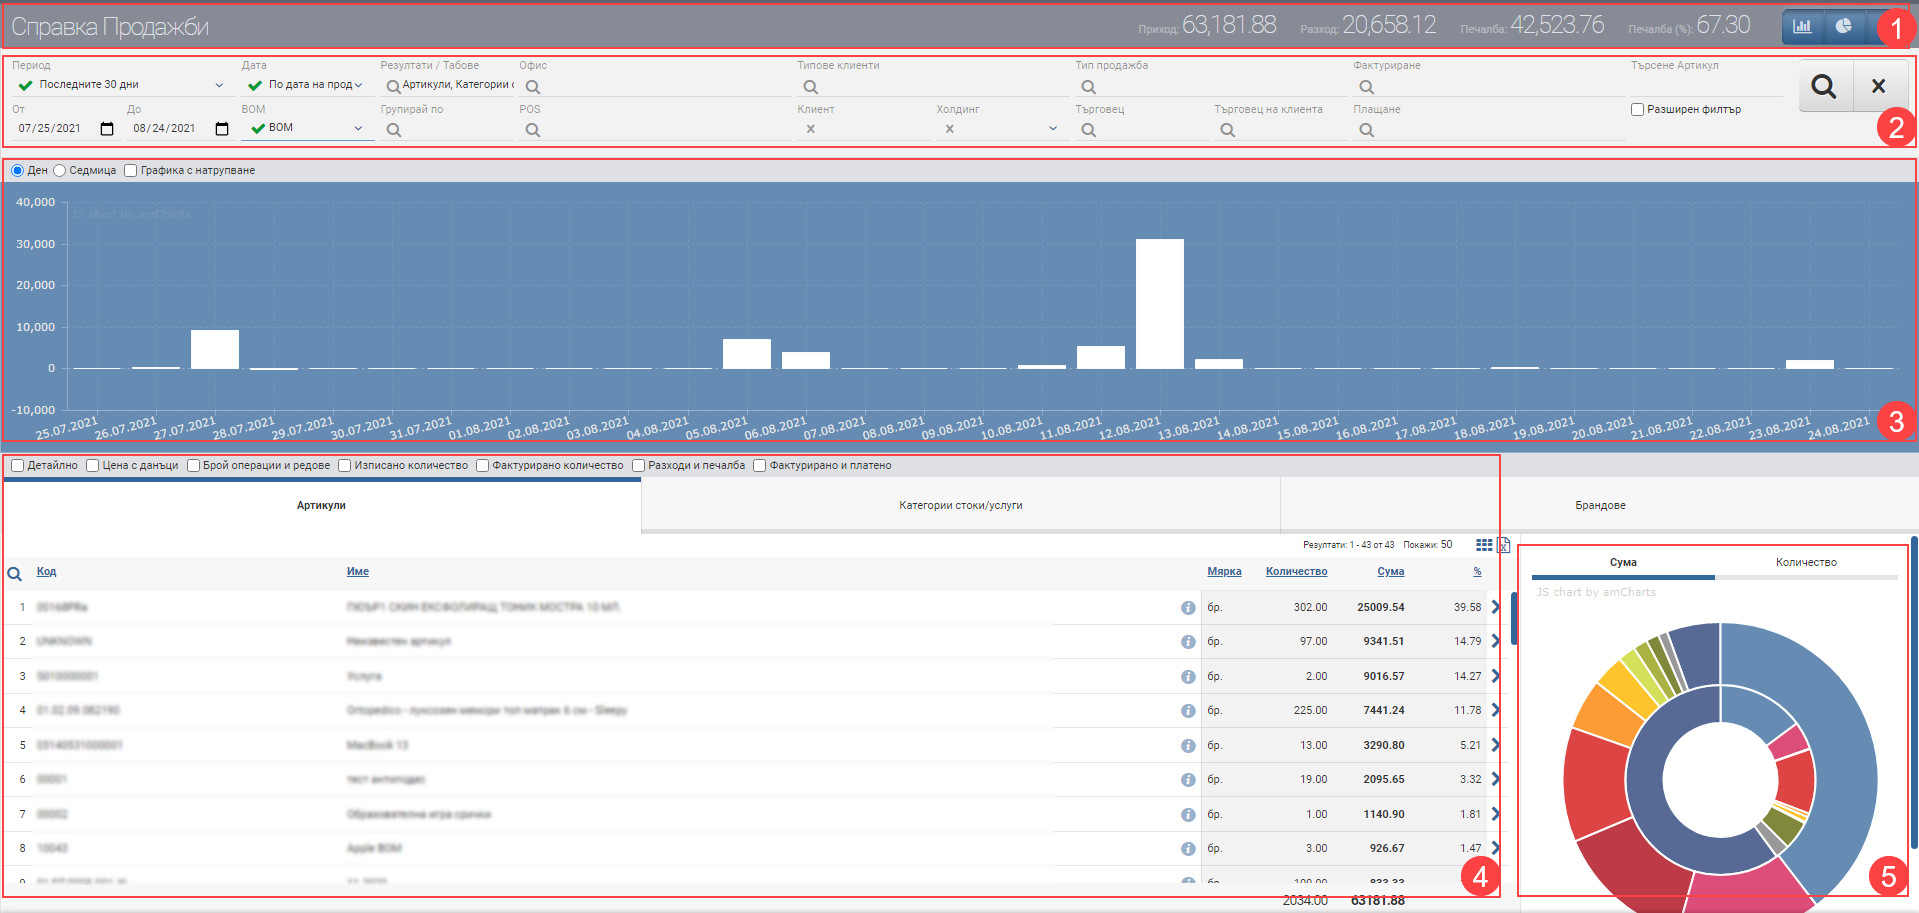
In the Header (1) you see three buttons that hide and show the Graph, Distribution and Filter respectively.
The filter (2) allows you to generate reports on sales based on specific criteria. The options are described below:
| Option | Description |
| From date/To date | Filter based on when the sale took place |
| Results/Tabs | Allows you to customize the Result. Select the tabs you want to see. |
| Group by | Allows you to choose by what you want to group sales |
| Company | Allows you to choose the company that made the sale |
| Office | Allows you to select the office from which the sale is made |
| Merchant | Allows you to select the trader who made the sale |
| Region | Allows you to select sales by region |
| Shop | Allows you to select the store where the sale was made |
| POS | Allows you to select the POS from which the sale was made |
| Type of customers | Allows you to select a customer type |
| Client | Allows you to select a customer |
| Holding | Allows you to select a holding |
| Article type | Allows you to select an item type |
| Template | Allows you to select a template |
| Quoting | Allows you to select a financial document |
| Payment | Allows you to choose the payment method – Bank transfer, cash, etc. |
| Groups | Allows you to select groups (if any are entered in the system) |
| Brand | Allows you to choose a brand |
| Search | Combined search field |
Graph (3) presents sales information. You have radio buttons that allow you to choose whether you want the chart to present daily, weekly or monthly sales data. You will need to click the search button in the Filter if you want to refresh the chart. You have another button that allows you to view the accumulation graph .
The result (4) will be a list of sales based on the criteria you have specified. By default, the system will show you the following columns:
| Column | Description |
| Code | Item code |
| Name | Item name |
| Brand | Brand of item |
| Measure | Measure of item |
| Quantity | Available quantity of item |
| Sum | The amount of the item |
| % | Percentage of sale |
If you want to get more information about your sales, there are checkboxes that add columns to the list of results:
| Column | Description |
| Detail | Detailed information about the item |
| Price with taxes | Price with taxes |
| Number of operations and lines | The number of operations and their rows (two columns) |
| Quantity displayed | The quantity that has been discharged |
| Invoiced quantity | The quantity invoiced |
| Expenses and Profit | Costs and profit on sale |
| Invoiced and paid | The quantity invoiced and paid |
Distribution (5) represents your sales by quantity. Hover over the different pieces to get more information. The outer circle represents information for the specified period and the inner circle represents information for the previous period.