

The Sales Dashboard contains concentrated information on sales activity for a period of 10/30/60 or 90 days. Designed for use by users in salesperson and sales manager roles. The interface includes data on:
- pending sales,
- unpaid financial sales documents,
- stock by item by warehouse,
- Summary information and graph of sales by multiple sections,
- all tasks in three views.
The interface consists of Header (1), Sales Pending (2), Revenue Pending (3), Schedule (4) and Tasks (5):
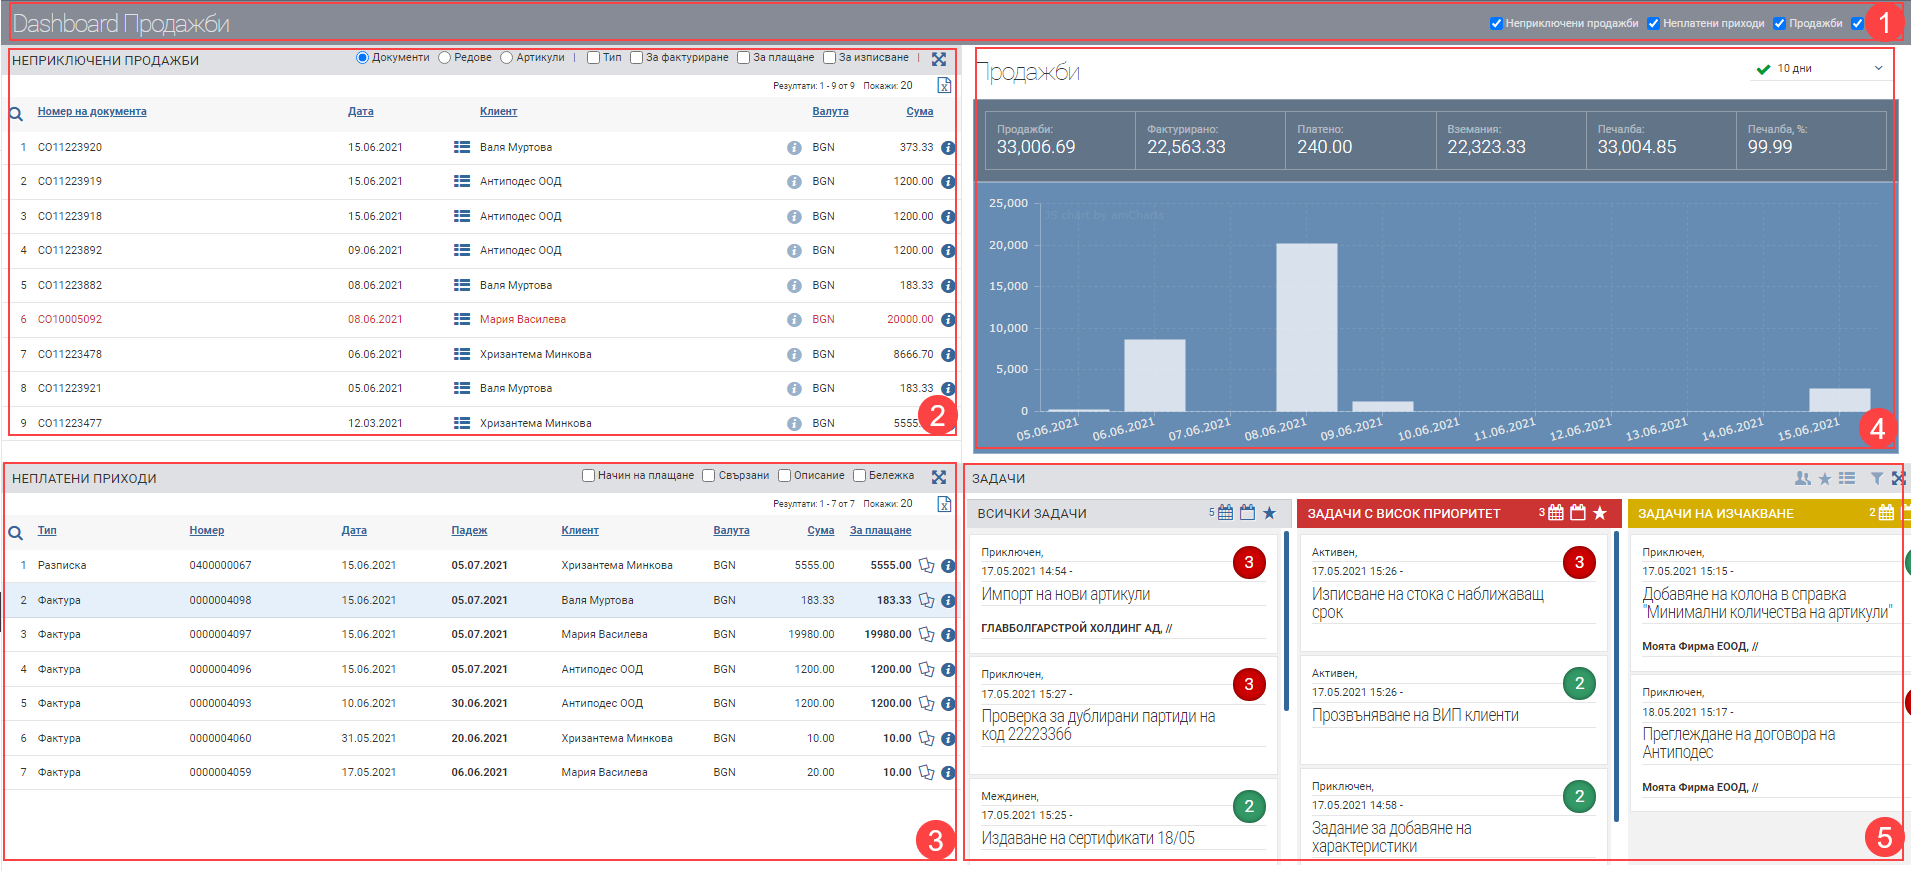
Header (1)
In the Header (1) you see the interface name and checkboxes that control which fields will be visible in the Dashboard. Each field displays information about specific objects according to the user’s permissions.
Uncompleted sales (2)
This field displays the merchant’s active sales in document/row/article views and includes a list of information about them. An active sale is one in which:
- no financial document is entered for the full amount and quantity of the sale.
- not all of the quantity pledged in the sale is listed.
It is possible to add additional information to the table using the following checkers:
- Type – adds a column with the document type
- For Invoicing – adds Invoiced columns (for what portion of the sale amount a financial document has been issued) and Remaining to be invoiced (for what portion of the sale amount a financial document has not yet been issued).
- For payment – adds columns Paid (how much of the amount of the finance document issued for the sale has been paid for) and Pending (how much of the amount of the finance document issued for the sale has not yet been paid for).
- Discharge – adds columns Quantity ( what quantity the sale is for), Remaining to be discharged ( how much of the quantity in the sale has not yet left the warehouse) and Discharged (how much of the quantity in the sale has already left the warehouse).
Unpaid revenue (3)
The field displays the merchant’s unpaid sales finance documents and includes a list of information about them. It is possible to add additional information to the table using the following checkers:
- Payment method – adds a column showing the selected payment method in the financial document.
- Related – adds a column of related transactions to the financial document, including links to them.
- Description – adds a column with the entered description of the financial document.
- Note – adds a column with the note entered on the financial document.
Graphics (4)
The field displays the following summary information and sales graph by multiple sections for a 10/30/60 or 90 day period:
- Sales – sum of all sales of the trader for the selected period.
- Invoiced – amount of financial documents issued by sales for the selected period.
- Paid – sum of all payments on financial documents on sales of the trader for the selected period.
- Receivables – sum of all unpaid financial documents (Invoiced – Paid)
- Profit
- Profit, %
Tasks (5)
Displays all tasks in a table with the following columns:
| Column | Description |
| Priority | Indicates with what priority the task is entered: – a figure 1 in grey means that the task is low priority; – a number 2 in green means that the task has normal priority; – a number 3 in red means that the task is high priority. |
| Name of task | Task name and task file. When you click on your name a task file opens. |
| Contractor | The contractor associated with the task. |
| Status | Shared task status. |
| Commissioned by | The user who created the task. |
| Date of award | Date of assignment. |
| Deadline for implementation | Deadline. |
You can choose how your tasks look from three views – as a list, in Shared Status view, or in Own Status view.