

KPIs or the KPIs page is where you can find out at a glance what’s going on with your business. There you will find the key metrics that indicate the “health” of your company.
The Bi module consists of the following elements:
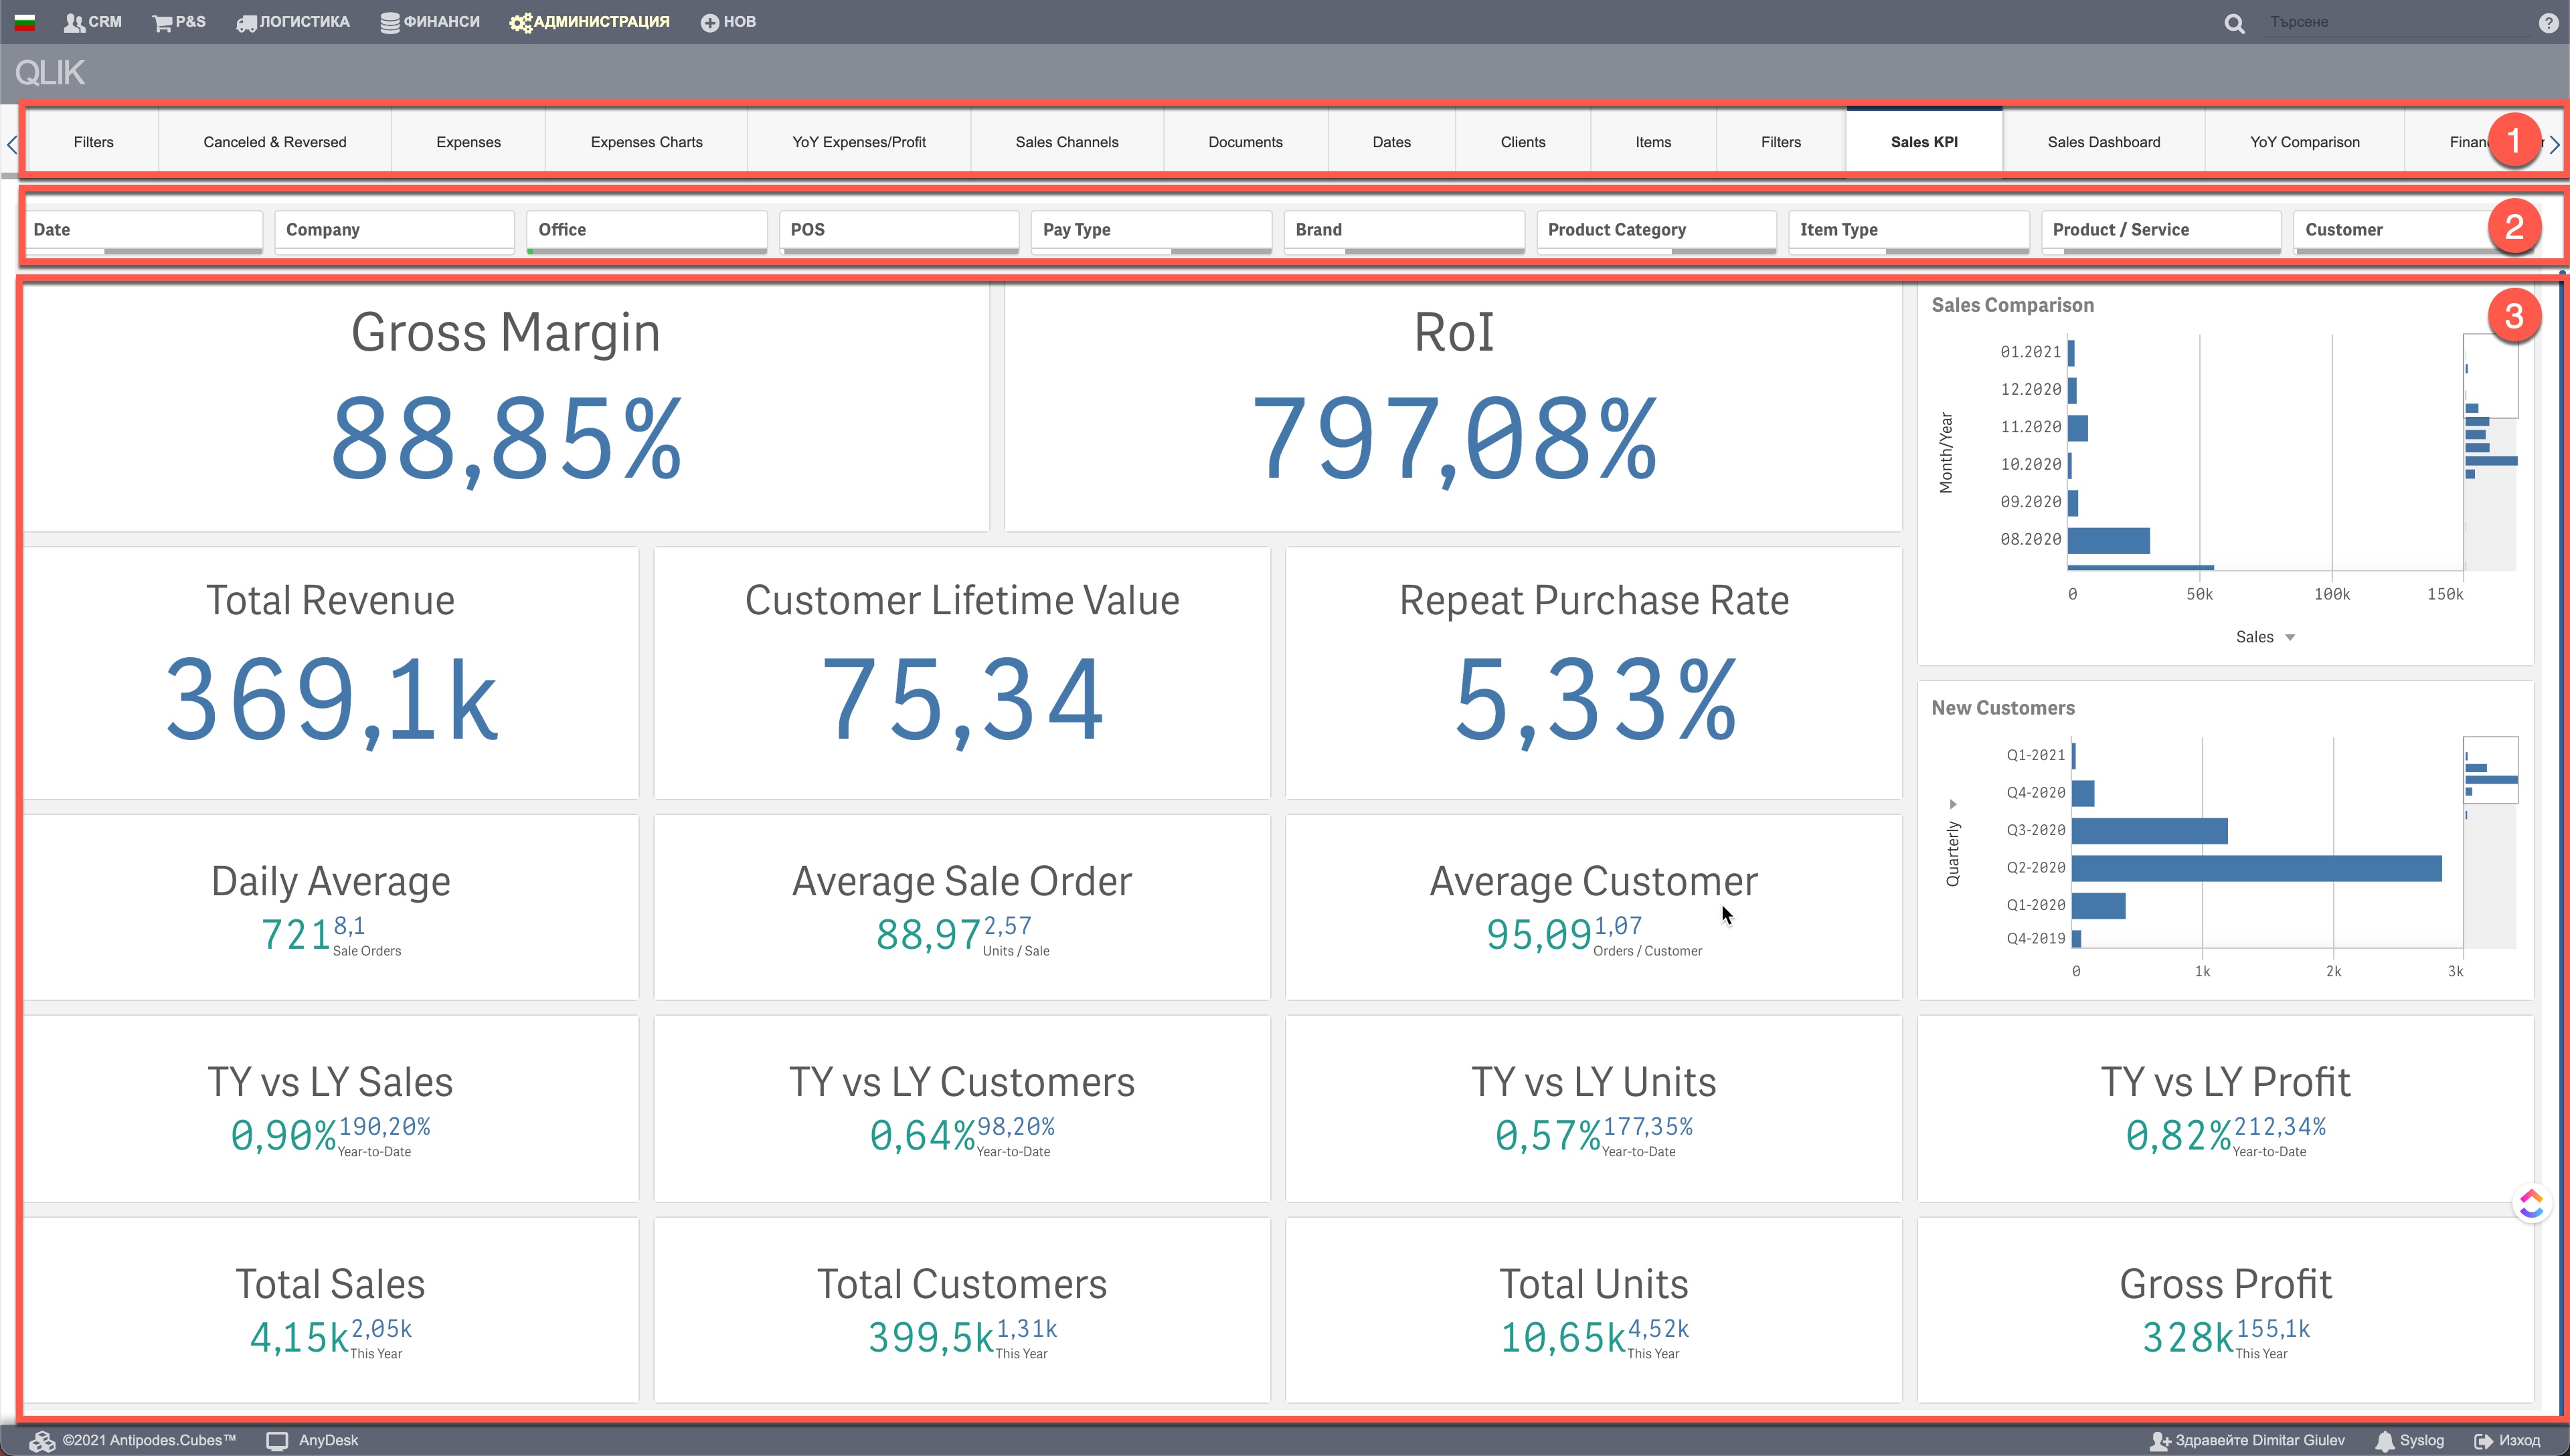
Tabs (1) – Tabs are individual dashboards, each showing an important aspect of your business.
Filters (2) – the parameters by which you can make cuts.
Note that any selected filter applies to all other boards.
If you want to filter by a parameter that is missing in the filter bar, you can always click on the “Filters” tab, where we have prepared many more parameters to work with.
KPIs Dashboard (3)
| KPI | Name | Explanation | Formulas of calculation |
| Gross Margin | Profit / Turnover | Takes into account only the cost of products as a basis | (SUM(SO) -SUM(cogs)) / SUM(SO) |
| RoI | Profit / Cost of products | Return on investment – | (SUM(SO)-SUM(cogs)) / SUM(cogs) |
| Total Revenue | Turnover | Amount of revenue | (SUM(SO) |
| Customer Lifetime Value (CLV) | Revenue from one customer | An extremely important indicator for any business. Shows how much average revenue comes from a customer. | SUM(SO) / COUNT(customers who made purchases) |
| Repeat Purchase Rate | Re-purchase ratio | Shows how successfully you sell more than once to your customers | Count of customers with multiple purchases / Customers who made purchases |
| Daily Average | Average daily sales | Average daily sales amount Average daily number of sales | SUM(SO) / Number of days between the first and the latest SO COUNT(SO) / Number of days between the first and the latest SO |
| Average Sales Order | Average value per sale | Average value per sale Average number of items in one sale | SUM(SO) / COUNT(SO) SUM(quantity of so rows) / COUNT(SO) |
| Averge Customer | Average revenue per customer | Equal to Revenue per Customer (CLV) Average number of sales per customer | SUM(SO) / COUNT(customers who made purchases) SUM(quantity of SO rows) / COUNT(SO) |
| TY vs LY Sales | Sales compared to last year | Current year sales / sales for the whole of last year Sales current year / sales for the same period last year | SUM(SO for this year) / SUM(SO for the whole previous year) SUM(SO for this year) / SUM(SO for the year before till todays date) |
| TY vs LY Customers | Customers compared to last year | Number of customers current year / number of customers for the whole of last year Number of customers current year / number of customers for the same period last year | COUNT(new customers for this year) / COUNT(new customers for the whole previous year) COUNT(new customers for this year) / COUNT(new customers for the previous year till todays date) |
| TY vs LY Units | Number of items sold compared to last year | Number of items sold current year / number of items sold for the whole of last year Number of items sold current year / number of items sold in the same period last year | SUM(units sold for this year ) / SUM(units sold for the whole previous year) SUM(units sold for this year ) / SUM(units sold for the previous year till todays date) |
| TY vs LY Profit | Profit compared to last year | Profit current year / profit for the whole of last year Profit current year / profit same period last year | (SUM(SO for this year) – SUM(cost of this years sales)) / (SUM(SO for the previous year) – SUM(cost of the slaves for the previous year)) (SUM(SO for this year) – SUM(cost of this years sales)) / (SUM(SO for the previous year till todays date) – SUM(cost of the slaes for the previous year till todays date)) |
| Total Sales | Total number of sales | Total number of sales Number of sales current year * not affected by the selected filters | COUNT(SO) COUNT(SO for this year) |
| Total Customers | Total number of clients | Total number of clients Number of customers current year * not affected by the selected filters | COUNT(partners) COUNT(partners created this year) |
| Total Units | Total number of items sold | Total number of items sold Number of items sold current year * not affected by the selected filters | SUM(quantity of units SUM(quantity of units this year) |
| Gross Profit | Total amount profit | Total profit Profit current year * not affected by the selected filters | SUM(SO) – SUM(cogs) SUM(SO for this year) – SUM(cogs of this year sales) |
There are also two graphs in the dashboard:
Sales – shows the sales. On the Y-coordinate you can change the reporting period – year, quarter, month. By the X-coordinate you can select the number of items sold, sales, profit and number of items.
Clients – shows the clients. On the Y-coordinate you can change the reporting period – year, quarter, month. By X-coordinate you can choose to view only new customers for the period or total customers for the period.